Our Location
304 North Cardinal St.
Dorchester Center, MA 02124


The WordPress debug log is a text file that records every PHP error, warning, and notice your site generates — including the ones nobody ever sees on screen.
Think of it as a flight recorder for your site: it runs quietly in the background the whole time, and you only pull it up after something goes wrong.
Something just broke on your site, and you have no idea why? That’s the moment this file matters most. The problem is WordPress buries it deep on the server — normally you’d need your hosting control panel, a file manager, and a raw text file to read a single line.
Quick Answer: The debug log is a file at /wp-content/debug.log that WordPress writes to once you enable WP_DEBUG and WP_DEBUG_LOG in wp-config.php. It’s the fastest way to find out why something on your site is broken. Logmate reads it inside your dashboard so you never need FTP.
WordPress has a built-in debugging system controlled by constants in your wp-config.php file. When you enable WP_DEBUG and set WP_DEBUG_LOG to true, WordPress starts writing errors to a file called debug.log.
By default, this file lives at /wp-content/debug.log — though some hosts or configurations write it elsewhere. Every PHP error, deprecated function call, undefined variable, and database query problem gets logged here with a timestamp and the file/line where it occurred.
The log records three main types of entries:
Open your wp-config.php file and add or update these three constants. Place them above the line that reads /* That's all, stop editing! */.
define( 'WP_DEBUG', true );
define( 'WP_DEBUG_LOG', true );
define( 'WP_DEBUG_DISPLAY', false );
Setting WP_DEBUG_DISPLAY to false is important on a live site — it stops errors from printing directly to the page, which would expose your file structure to visitors. With this configuration, errors go to the log file silently.
Warning: Never leave WP_DEBUG_DISPLAY set to true on a production site. It can expose sensitive server path information to anyone visiting the page.

Once the log is enabled, you still need to read it — and that’s where the friction starts. The file grows continuously. On an active site, it can reach megabytes quickly, full of repeated entries that are hard to scan manually. Finding the one error that actually matters means scrolling through hundreds of lines of raw text.
Logmate solves this by bringing the debug log into your WordPress dashboard. It reads your PHP log file and presents entries in a searchable, filterable table, organized by error type, message, source file, occurrence count, and last-seen timestamp.
Instead of finding the log file and scrolling through it, you open the Logs screen and see what’s actually happening.
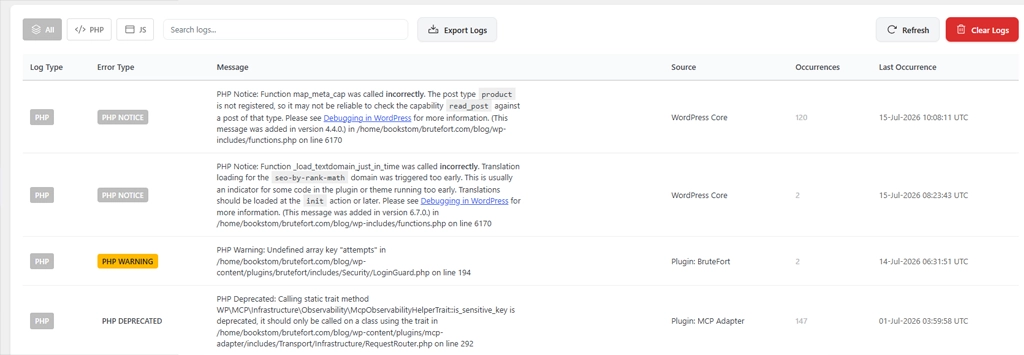
Logmate also captures JavaScript errors separately, which the PHP debug log doesn’t cover at all. JS errors are usually invisible unless someone is actively watching the browser console — Logmate surfaces them in the same interface alongside your PHP errors.
Left unchecked, the debug log will keep growing. On busy sites or sites with a lot of deprecated notices, it can consume significant disk space within weeks.
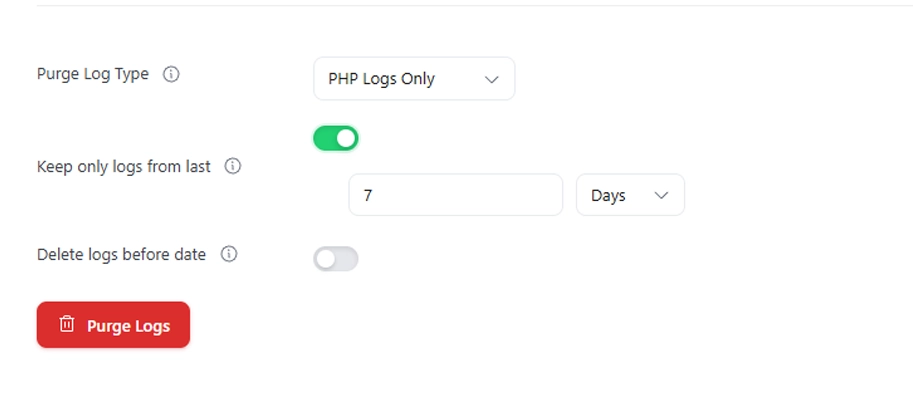
Logmate handles this with a retention setting: keep only logs from the last N days, and purge everything older. You can also purge by log type — just PHP, just JS, or all logs — and target a specific date if you want to clean up before a certain point.
The log file itself is safe to keep enabled on production as long as WP_DEBUG_DISPLAY is false. The risk is the log file being publicly accessible via a direct URL. Most WordPress configurations block this, but it’s worth verifying that /wp-content/debug.log returns a 403 or 404 rather than the file contents. Logmate stores its log files in a protected location with a randomized filename to avoid this exposure.
By default, debug.log is written to /wp-content/debug.log on your server. Some hosting environments or custom configurations redirect it elsewhere. Logmate’s System Info screen shows you the exact file path for both your PHP and JS log files, so there’s no guesswork involved.
Without a plugin, yes — you’d need FTP or access to your hosting file manager to open the file. Logmate eliminates that requirement by reading the log and presenting it inside the WordPress admin, so anyone with admin access to the dashboard can see the errors without touching the server.
PHP errors happen on the server side — they affect page generation, database queries, and plugin functionality. JavaScript errors happen in the browser — they affect interactive elements, scripts, and front-end behavior. The PHP debug log only captures the server side. Logmate captures both, letting you see the full picture of what’s going wrong on any given page.
The WordPress debug log is one of the most useful diagnostic tools available — it’s just not very accessible by default. Logmate brings it into your dashboard, adds JavaScript error capture, and handles log retention so it doesn’t bloat your server over time.
If this helped, follow us for more WordPress developer guides. You might also like:

