Our Location
304 North Cardinal St.
Dorchester Center, MA 02124

Your site just threw a white screen, or a client emailed asking why the contact form stopped working, and you have no idea where to even look. You’ve searched “best WordPress debug plugin” and landed on a handful of names that all sound like they do the same thing.
They don’t. Every WordPress site generates PHP errors, and most generate silent JavaScript errors too — the plugin you pick determines whether you actually see them or stay stuck guessing.

We reviewed each plugin’s official WordPress.org listing, changelog history, and feature set. The goal: see what each one actually shows you, whether it’s safe to run on a live site, and who it’s really built for.
Quick Answer: For most site owners, LogMate is the best WordPress debug plugin. It reads your PHP and JavaScript error logs from inside the dashboard, safely, on a live site, for free.
If you’re actively developing and need to inspect database queries and hooks in real time, pair it with Query Monitor. And since a lot of “random site errors” turn out to be login attacks in disguise, BruteFort (our bonus 6th pick) rounds out the toolkit.
| Plugin | Best For | Price | Standout Feature |
|---|---|---|---|
| 1. LogMate | Live-site PHP & JS error monitoring | Free | Unified PHP + JS log viewer, no FTP needed |
| 2. Query Monitor | Active theme & plugin development | Free | Per-request query, hook & HTTP call inspector |
| 3. Health Check & Troubleshooting | Isolating plugin/theme conflicts | Free | Troubleshooting Mode affects only your session |
| 4. WP Debugging | Quick WP_DEBUG toggling | Free | Flips debug constants with no wp-config.php edits |
| 5. Debug Bar | Lightweight legacy debugging | Free | Simple admin-bar panel for queries & notices |
| Bonus: BruteFort | Login & brute-force security | Free | Rate limiting, custom login URL, geo-blocking, IP rules |
Picking the best debug plugin for WordPress isn’t about which one logs the most data. It’s about matching the tool to what you’re actually trying to diagnose.
We looked at what each plugin actually captures — PHP errors, JS errors, database queries, hooks, or HTTP calls. We also checked whether it’s safe to leave running on a live site, or strictly a development-only tool.
We also weighed ease of setup (does it need wp-config.php edits or FTP access) and how actively each plugin is maintained. Every entry below includes genuine downsides, not just a highlight reel, so you can pick based on your actual situation rather than a feature checklist.
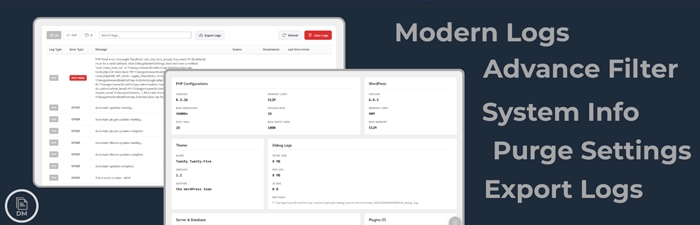
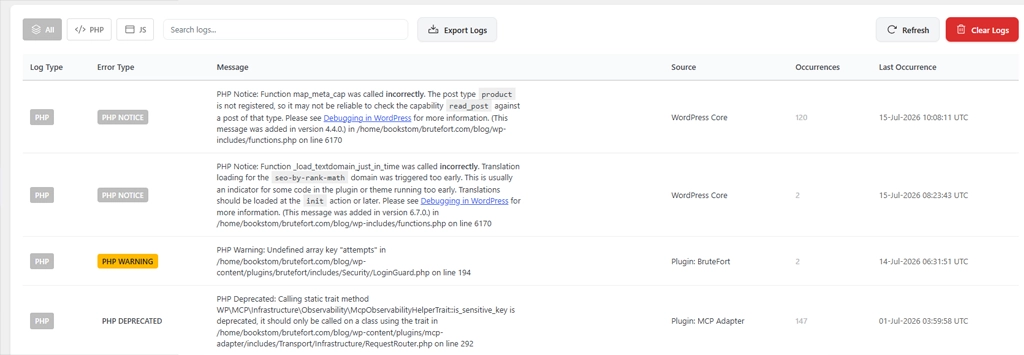
LogMate makes your WordPress error log accessible from inside the dashboard. It reads your PHP debug log — the file that captures fatal errors, warnings, notices, and deprecated function calls.
It then shows that log as a structured, searchable table, with occurrence counts and last-seen timestamps for every entry.
Best for: site owners and developers who want to monitor PHP and JS errors on a live site without FTP or server access.
What sets it apart is JavaScript error capture — browser-side errors from real visitor sessions get logged server-side, right alongside PHP errors. That matters because broken forms, frozen sliders, and jQuery conflicts never show up in a PHP debug log at all.
It also handles log retention (auto-purge after N days), one-click export, and a SCRIPT_DEBUG toggle. A System Info screen rounds it out, showing your PHP version, WordPress version, database details, and every active plugin.

Pros:
wp-config.php editingCons:
Pricing: Free, with every current feature included.
Verdict: If you want to know what’s actually breaking on your live site without touching a server, LogMate is the best WordPress debug plugin for that job.
Query Monitor is the developer’s diagnostic panel. It adds an admin-bar menu showing database queries, hooks, conditionals, HTTP API calls, and script/style enqueues for the exact page you’re looking at.
Best for: theme and plugin developers who need to see what’s happening during a specific page load, right now.
It doesn’t read your PHP debug log file, capture JS errors from real visitors, or offer any log retention. It’s a real-time inspector for the current request, not a logging system — which is exactly why it pairs so well with LogMate instead of competing with it.
Pros:
Cons:
Pricing: Free.
Verdict: If you’re actively building or customizing a theme or plugin, Query Monitor is the best WordPress debug plugin for watching exactly what a page load is doing.
Health Check & Troubleshooting is an official community plugin built specifically to answer one question: is this a plugin conflict, a theme conflict, or something else? Its Troubleshooting Mode disables all plugins and switches to a default theme — but only for your own logged-in session, not for other visitors.
Best for: anyone who suspects a specific plugin or theme is causing an error and wants to test that theory without taking the live site down for visitors.
You can then re-enable plugins one at a time until the error reappears, which tells you exactly which one is responsible — far faster than guessing.
Pros:
Cons:
Pricing: Free.
Verdict: Pair this with LogMate: LogMate tells you an error is happening, Health Check helps you find out which plugin or theme is causing it.
WP Debugging is a minimal plugin, maintained by contributors close to WordPress core, that toggles WP_DEBUG, WP_DEBUG_LOG, and WP_DEBUG_DISPLAY from the admin — no manual edits to wp-config.php required.
Best for: developers who frequently switch debug mode on and off during local development and would rather not touch wp-config.php every time.
It doesn’t display log contents, capture JS errors, or offer any analysis of its own — it just flips the constants. You’ll still need something like LogMate to actually read what gets logged once it’s on.
Pros:
wp-config.php editing requiredCons:
Pricing: Free.
Verdict: A fine convenience tool for local development, but it’s a companion to a real log viewer, not a substitute for one.
Debug Bar adds a panel to the WordPress admin bar showing PHP warnings and notices, database queries, and query count and execution time for the current page load. It’s one of the older tools in this list.
Best for: teams already accustomed to it on older projects, or anyone who wants a very simple admin-bar panel without Query Monitor’s full depth.
Query Monitor has largely superseded it for new setups, offering the same core idea with far more detail and active maintenance.
Pros:
Cons:
Pricing: Free.
Verdict: Fine if it’s already part of your workflow; for anything new, Query Monitor is the more capable modern alternative.
BruteFort, from the same developer as LogMate, isn’t a debug plugin — it’s a login security plugin. We’re including it because “why does my site keep acting up” is a question that often turns out to be an attack, not a bug.
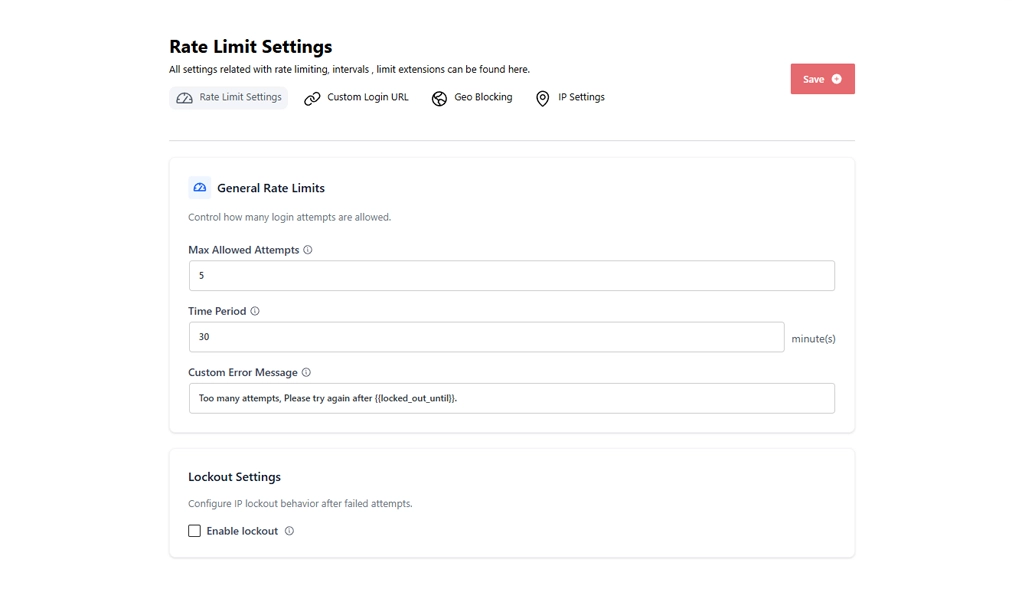
Best for: anyone whose “mystery errors” turn out to be a flood of failed login attempts hammering the server, not a code bug at all.
BruteFort rate-limits login attempts, locks out an IP after repeated failures, replaces /wp-login.php with a custom slug, and can block or allow logins by country. All of it gets logged, so you can see exactly what’s hitting your login page.
Pros:
Cons:
Pricing: Free, with every current feature included.
Verdict: Not a replacement for anything above, but a genuinely useful companion once you realize some of your “errors” are actually bots at the door.
There’s no single best WordPress debug plugin for every situation — the right pick depends on what you’re actually diagnosing, not which one has the longest feature list.
If you run a live site and want to catch PHP and JS errors affecting real visitors, start with LogMate. If you’re actively building a theme or plugin, add Query Monitor during development. If you suspect a specific plugin is the culprit, use Health Check’s Troubleshooting Mode to confirm it.
Many site owners end up running LogMate permanently for monitoring, with Query Monitor and Health Check brought in only when actively troubleshooting — that combination covers nearly every debugging scenario without adding constant overhead.
LogMate is the best all-around pick because it reads both PHP and JavaScript errors from a live site safely, with no FTP or server access required. Pair it with Query Monitor if you’re actively developing a theme or plugin.
It’s restricted to admins by default, but it adds real overhead to every page load and exposes internal request data, so it’s best deactivated on production once you’re done debugging.
Often, yes. Log viewers like LogMate and per-request inspectors like Query Monitor solve different problems and don’t overlap, so running both covers far more ground than either alone.
No. Debug plugins surface what’s happening; you or your developer still make the fix. Health Check can narrow down which plugin or theme is responsible, which speeds up the fix considerably.
Log viewers like LogMate read an existing file and add minimal overhead, so they’re safe to run continuously. Per-request inspectors like Query Monitor and Debug Bar add noticeable overhead and are best used only during active debugging.
For most WordPress sites, LogMate is the best debug plugin if your priority is seeing what’s actually breaking on a live site, for free, with no FTP required. Pair it with Query Monitor while actively developing, and Health Check when you need to isolate a specific plugin or theme conflict. If those “errors” turn out to be login attacks instead, BruteFort is the tool that shuts them down.
You might also like:

