Our Location
304 North Cardinal St.
Dorchester Center, MA 02124


Something on your WordPress site just broke, and you know the error log has the answer — you just don’t know how to get to it. That’s normal. By default, the log is a raw text file buried on your server, and reaching it usually means FTP, SSH, or a trip through your host’s file manager.
PHP fatal errors, plugin conflicts, deprecated function warnings, failed database queries — they all get written to the log the moment they happen. This guide covers every practical method for viewing them, ranked from easiest to most involved.
Quick Answer: The fastest method is a dashboard log viewer like LogMate — no server access needed. FTP and hosting control panels work too, but both mean more clicks and raw, unfiltered text.
| Method | Server Access Needed | Effort | Best For |
|---|---|---|---|
| LogMate (dashboard) | No | Low | Ongoing monitoring, filtering, JS errors |
| Hosting control panel | Usually no | Low–Medium | Server-level errors, 500s |
| FTP / file manager | Yes | Medium–High | One-off raw file access |
LogMate removes the server access requirement entirely. Once installed, it reads your debug log and presents every PHP and JavaScript error in a structured table right inside wp-admin.
You can filter by type, search by message or source file, and see occurrence counts and last-seen timestamps for each one.
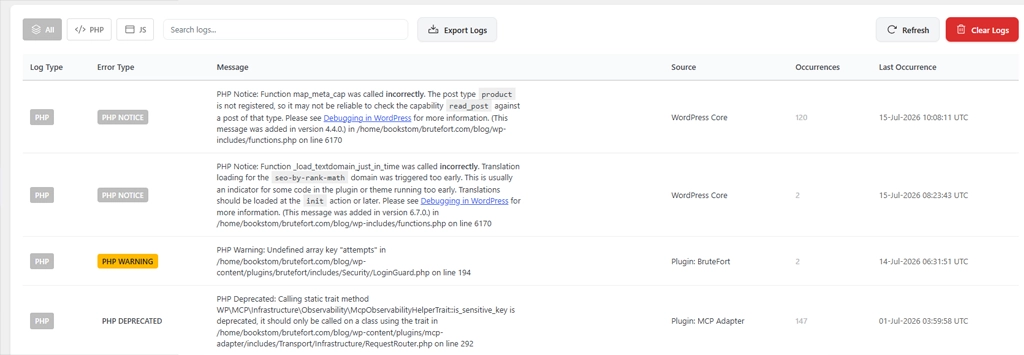
Instead of downloading a raw file and scrolling through it, open LogMate → Logs and see a clean view of what’s actually breaking. The occurrence count is especially useful: an error that’s fired 1,200 times in the last 24 hours is immediately a priority, while a one-off notice gets deprioritized on its own.
LogMate also captures JavaScript errors that never touch the PHP debug log at all — browser-side errors from visitor sessions, recorded server-side and shown in the same table. That’s the complete picture, from one screen.
Many shared and managed hosts include a log viewer in their control panel. cPanel often has an “Error Log” link under Metrics that shows recent server errors. This is separate from the WordPress debug log — it’s server-level, not application-level, so the two complement rather than overlap.
The host’s error log is useful for server configuration issues, 500 errors, and PHP errors that happen before WordPress even loads. The WordPress debug log (via LogMate or directly) catches application-level errors inside WordPress’s own execution. Checking both is worth the habit for full coverage.
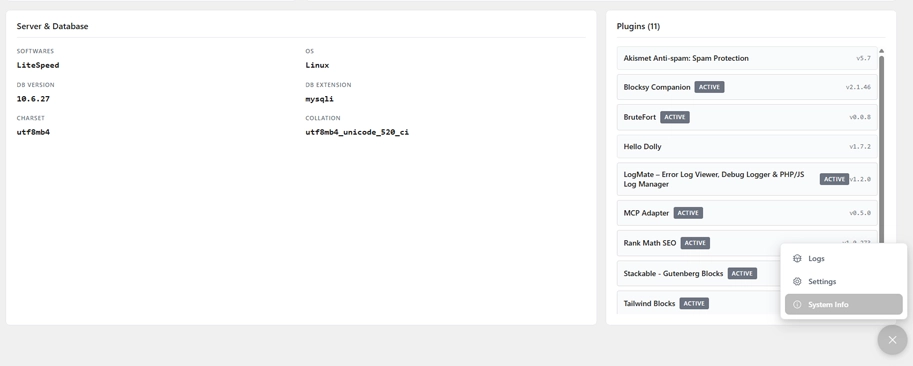
The default WordPress error log location is /wp-content/debug.log when WP_DEBUG_LOG is enabled. Some hosts write it elsewhere — LogMate’s System Info screen shows the exact file paths for your PHP and JS logs, so there’s no guesswork.
To read it directly, connect via FTP using a client like FileZilla, or open the file manager in your hosting control panel. Navigate to /wp-content/, find debug.log, and open or download it — it’s plain text, so any text editor works.
Note: on a busy site the log can run thousands of lines long, with repeated entries burying what actually matters. You’re scrolling raw text every time, with no filtering or search.
Before you can view error logs, WordPress needs to be writing them. Add these lines to wp-config.php above the “stop editing” comment if they aren’t already there:
define( 'WP_DEBUG', true );
define( 'WP_DEBUG_LOG', true );
define( 'WP_DEBUG_DISPLAY', false );
Important: setting WP_DEBUG_DISPLAY to false is critical on a live site. Without it, PHP errors print directly to the page, exposing server paths and file structure to any visitor. With this configuration, errors go to the log file silently, and LogMate reads the log from this point forward.
By default at /wp-content/debug.log on your server. Some hosting environments or custom configurations write it to a different path. LogMate’s System Info screen shows the exact PHP log path and JS log path for your specific install, removing any guesswork.
If improperly secured, yes — visiting yourdomain.com/wp-content/debug.log directly could expose its contents. Most WordPress configurations protect this, but it’s worth verifying the URL returns a 403 or 404 rather than the file itself. LogMate stores its own log files at a randomized, non-guessable path to avoid this exposure entirely.
Yes. LogMate includes an Export Logs button at the top of the Logs screen. It generates a downloadable file of your current entries that you can send to a developer or support team — cleaner than downloading the raw debug.log and sharing that, since the export is structured and filterable first.
The most common reason is that WP_DEBUG or WP_DEBUG_LOG isn’t enabled. Without those constants set in wp-config.php, WordPress doesn’t write errors anywhere. Verify both are set to true. Some managed hosts also disable WP_DEBUG by default and override it server-side — check with your host if enabling it in wp-config.php doesn’t seem to work.
Your WordPress error log is one of the most useful diagnostic tools you have — the barrier is just getting to it easily. LogMate removes that barrier by surfacing both PHP and JavaScript errors inside your dashboard, with filtering, search, occurrence counts, and export — no FTP or server access needed.
You might also like:

