Our Location
304 North Cardinal St.
Dorchester Center, MA 02124


Something just broke on your WordPress site, and your host says “check the debug log” — but you don’t have FTP credentials or SSH access handy. That’s a normal spot to be in. Agencies, client-site managers, and anyone on managed hosting run into this constantly.
Most WordPress debugging tasks can now be done entirely from inside the dashboard. This guide covers five practical techniques for diagnosing PHP errors, JavaScript problems, and plugin conflicts without touching FTP or the server directly.
Quick Answer: A log viewer plugin like LogMate reads your debug log, JS errors, and server environment straight from wp-admin. You get the same visibility as FTP, minus the file manager.
The WordPress debug log — the file that captures PHP errors, warnings, notices, and deprecated function calls — lives on the server at /wp-content/debug.log by default. Without a plugin, the only way to read it is via FTP or file manager.
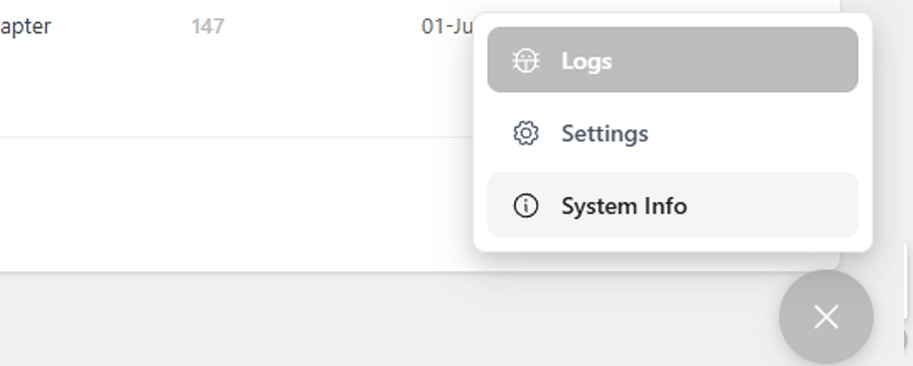
LogMate solves this completely. It reads the debug log and presents it as a structured, searchable table under LogMate → Logs. Each entry lists its type (fatal, warning, notice), message, source file, occurrence count, and last-seen timestamp. You can filter by PHP or JavaScript, search by message or file, and export the full log to share with a developer — all without touching the server.
The auto-refresh setting (down to 10-second intervals) lets you reproduce an error in one browser tab while watching it land in the Logs tab in real time, with no manual reloading.
WordPress JavaScript errors — broken interactive elements, forms that won’t submit, admin panels that stop responding — never appear in the PHP debug log. The traditional fix is opening dev tools on each page and scanning for red entries. That only shows errors from your own session, on the page you’re viewing right now.
LogMate’s JS error capture works differently. Enable the “Log JavaScript errors” toggle in Settings, and errors from any visitor’s browser get captured and recorded server-side. You see them in the same Logs table as your PHP errors, with occurrence counts that reveal patterns across all sessions. An error that only hits Safari on mobile, for example, shows up even though you’d never trigger it in your own testing.
Diagnosing compatibility issues — especially after a WordPress or PHP version change — usually means knowing your exact server environment. Normally that’s phpinfo() over SSH, or a support ticket to your host.
LogMate’s System Info screen shows all of it in one place: PHP version, memory limit, max execution time, upload max size, and max input vars, alongside WordPress version, active theme, database version, server software, and every active plugin.

This is invaluable when checking a plugin’s minimum PHP requirement against your actual server, or when a host’s support request asks for your configuration details.
Plugin conflicts almost always throw a PHP error that names the conflicting file directly. With LogMate running, you don’t need to deactivate plugins blindly one by one — read the error message first, spot the plugin from the file path, and go straight to the right one.
A fatal like Cannot redeclare plugin_function() in /wp-content/plugins/plugin-name/ tells you exactly which plugin to investigate. That’s the log-first approach: the answer is usually already in the error message.
Enabling WP_DEBUG, WP_DEBUG_LOG, and SCRIPT_DEBUG normally means editing wp-config.php over FTP. LogMate’s Settings panel lets you toggle SCRIPT_DEBUG straight from the dashboard — no file editing. SCRIPT_DEBUG forces WordPress to load full, unminified scripts, which turns cryptic minified errors into readable ones.

Note: WP_DEBUG and WP_DEBUG_LOG still need to be set in wp-config.php for LogMate to have a log to read. Many hosts — cPanel, Kinsta, WP Engine — now offer a way to toggle debug mode through their own control panel without FTP, so check your host’s documentation first.
A PHP fatal error that stops WordPress from loading locks you out of the dashboard entirely. At that point, FTP or a hosting file manager is the only way to deactivate the offending plugin. This is the one scenario where server access is genuinely unavoidable. The fix is preventative: run LogMate so you catch errors early, before a fatal takes the site down completely.
LogMate adds minimal overhead. It reads the existing debug log rather than intercepting every request. The main performance consideration is JS error capture, which injects a small script to collect browser-side errors. The impact is negligible on most sites and outweighed by the visibility it provides.
Yes. WooCommerce errors — payment gateway conflicts, checkout PHP errors, cart JavaScript failures — all surface in LogMate’s log viewer like any other WordPress error. The occurrence count is especially useful here: an error firing on every checkout load shows up as a high-frequency entry, making it easy to prioritize over low-volume notices elsewhere.
LogMate’s auto-refresh setting keeps the log view updated automatically at your chosen interval, which is useful during active debugging sessions. For monitoring between sessions, use the export feature to snapshot the current state and compare it against a previous baseline to spot what’s new.
Most WordPress debugging doesn’t actually require server access — it requires visibility into what the site is doing. LogMate provides that from inside the dashboard: PHP error logs, JavaScript error capture, system info, and debug settings management, all without opening an FTP client.
You might also like:

