Our Location
304 North Cardinal St.
Dorchester Center, MA 02124

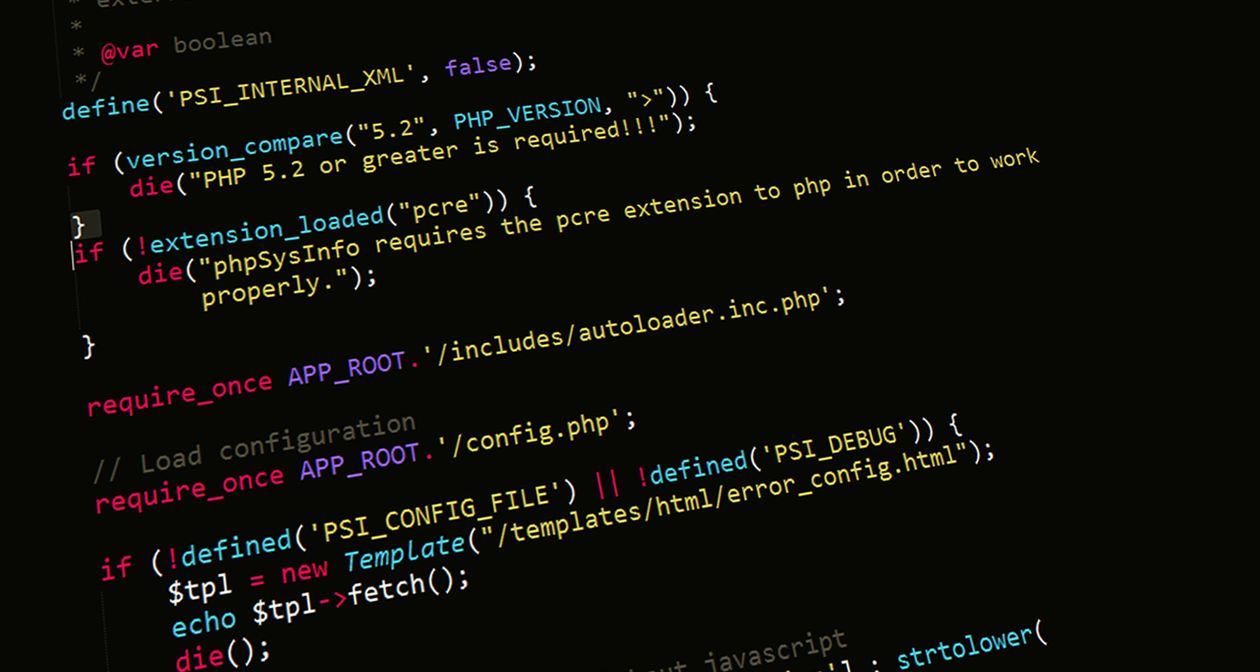
SCRIPT_DEBUG is a WordPress constant that forces the loading of full, unminified versions of WordPress’s own JavaScript and CSS files. Think of it like switching from a photocopy of a document back to the original — same content, but suddenly you can actually read the fine print.
When it’s enabled, instead of loading compressed, single-line script files that produce cryptic error references, WordPress loads the original, readable source files with proper line numbers and human-readable function names.
It’s a specific tool for a specific problem: debugging JavaScript errors in WordPress core scripts. This guide explains exactly what it does, when to use it, when not to bother, and how to enable it without touching wp-config.php directly.
Quick Answer: SCRIPT_DEBUG makes WordPress load unminified core JavaScript and CSS instead of the compressed production versions. Turn it on temporarily when a console error points to a file in wp-includes/ or wp-admin/ and you need a readable stack trace. Leave it off otherwise — it adds a small amount of page weight with no benefit outside active debugging.
WordPress ships with two versions of most of its own JavaScript and CSS files. The production version is minified — whitespace removed, variable names shortened, everything compressed to reduce file size and load time. The development version is the original source with comments, proper indentation, and full variable names.
Normally WordPress serves the minified version. When you enable SCRIPT_DEBUG, it serves the development version instead. Note: this only applies to scripts and styles that WordPress itself enqueues from /wp-includes/ and /wp-admin/. It does not affect scripts loaded by plugins or themes, which manage their own minification independently.
Here’s the practical difference when debugging a WordPress JavaScript error: instead of a console error pointing to line 1, character 4,832 of a minified bundle, you get a reference to a readable function name on a specific line in a named file. That’s the difference between knowing exactly where to look and hunting blind.
Use it when you’re seeing JavaScript errors in the WordPress admin or on the front end that reference WordPress core scripts. If a console error points to wp-includes/js/jquery/jquery.min.js or something in wp-admin/js/, enabling SCRIPT_DEBUG loads the unminified version of that file, making the error message significantly more useful.
It’s also useful when you’re developing or testing code that interacts with WordPress core JavaScript — editing or hooking into the block editor, customizer scripts, or media uploader behavior, for example. Having readable source files makes reading the code you’re working with much more practical.
Warning: don’t use it as a permanent setting on a production site. The unminified files are larger, which means slightly longer initial load times. For a debugging session it’s fine. As a permanent configuration it adds unnecessary load to every page.
Add this line to wp-config.php above the “stop editing” comment:
define( 'SCRIPT_DEBUG', true );Remove it or set it to false when you’re done debugging. It has no security implications — it just changes which version of the file WordPress serves.
LogMate’s settings panel includes a Modify SCRIPT_DEBUG toggle that enables and disables the constant directly from the WordPress admin — no FTP or wp-config.php editing needed. Go to LogMate → Settings and toggle it on for a debugging session, then toggle it off when you’re done. This is particularly useful for developers who need to switch in and out of debug mode frequently without leaving wp-config.php in a modified state.

WP_DEBUG enables PHP error reporting. It tells WordPress to surface PHP errors, warnings, and notices that would otherwise be suppressed. Combined with WP_DEBUG_LOG, those errors get written to the WordPress debug log.
SCRIPT_DEBUG is entirely separate and has nothing to do with PHP. It only affects which version of JavaScript and CSS files WordPress loads. You can have SCRIPT_DEBUG enabled without WP_DEBUG, and vice versa. For a full WordPress debugging session you typically want both: WP_DEBUG and WP_DEBUG_LOG to capture PHP errors in the debug log (viewable via LogMate’s Logs screen), and SCRIPT_DEBUG to get readable JavaScript error messages when tracing browser-side issues.
Marginally. The unminified files are larger than their minified counterparts, so initial page loads that pull those files are slightly slower. On a production site with caching enabled, the difference is mostly absorbed. The main reason to disable it when not actively debugging is habit rather than performance impact — it’s simply good practice to only run debug modes when you actually need them.
No. SCRIPT_DEBUG only controls scripts and styles enqueued by WordPress core from /wp-includes/ and /wp-admin/. Plugins and themes manage their own script versioning independently. Some plugins check the SCRIPT_DEBUG constant and use it to load their own unminified files as well, but this is optional behavior and not guaranteed across all plugins.
SCRIPT_DEBUG affects what gets served to all visitors while it’s active, not just your own browser. For capturing JavaScript errors from real visitor sessions without being in front of those browsers, LogMate’s JavaScript error capture is the more practical tool. It records browser-side errors from all sessions server-side, so you see errors happening across all visitors — not just in your own testing session with SCRIPT_DEBUG active.
Generally no. If your wp-config.php is version controlled and shared across environments, hardcoding SCRIPT_DEBUG as true affects all environments that use that config file. The safer approach is using environment-specific configuration or a tool like LogMate that manages the setting from the database rather than the config file.
SCRIPT_DEBUG is a targeted tool — it makes WordPress core JavaScript errors readable when minified output is obscuring the problem. Enable it when you need it, disable it when you don’t. LogMate lets you toggle it from the WordPress dashboard without touching wp-config.php, and captures JavaScript errors from all visitor sessions so you’re not dependent on reproducing them yourself.
You might also like:

