Our Location
304 North Cardinal St.
Dorchester Center, MA 02124

You want to see what’s actually breaking on your WordPress site, but you’re worried that flipping on debug mode will spill PHP errors onto the screen for every visitor to see. That worry is justified — it happens to sites that get one setting wrong.
The good news: enabling WordPress debugging safely is a five-minute job once you know which three constants to set, and in what combination. PHP fatal errors, warnings, notices, and deprecated function calls are normally suppressed entirely. Once debugging is configured correctly, they get written to a private log file instead — visible to you, invisible to visitors.
This guide covers the complete, safe way to enable WordPress debugging on a live site, plus the one combination of settings that will expose errors publicly if you get it wrong.
Quick Answer: Set WP_DEBUG to true, WP_DEBUG_LOG to true, and WP_DEBUG_DISPLAY to false in wp-config.php. That combination logs every PHP error to a file silently, without printing anything to the page. Skip the file entirely by using LogMate’s dashboard toggle instead.
WordPress debugging is controlled by constants in wp-config.php. You need all three of these set correctly for safe, effective error logging on a production site:
define( 'WP_DEBUG', true );
define( 'WP_DEBUG_LOG', true );
define( 'WP_DEBUG_DISPLAY', false );
Place these above the line that reads /* That's all, stop editing! Happy publishing. */
/wp-content/debug.log, which becomes your WordPress debug log.true. So if you only set WP_DEBUG without explicitly setting this to false, PHP errors will print to your pages for every visitor to see. Warning: always set this to false on a live site.For extra safety, add this line too. It suppresses error display at the PHP level in case a plugin overrides WP_DEBUG_DISPLAY:
@ini_set( 'display_errors', 0 );With WP_DEBUG_LOG set to true, WordPress writes errors to /wp-content/debug.log. That’s the default WordPress error log location. Some hosting environments write it elsewhere — LogMate’s System Info screen shows the exact path for both your PHP log and JS log files on your specific installation.
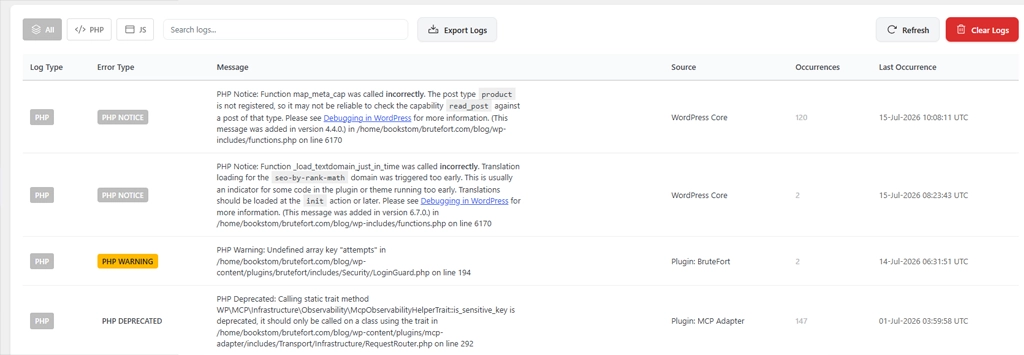
Reading the raw log file means FTP or file manager access every time something breaks. LogMate reads it for you from inside the WordPress admin instead — filterable, searchable, with occurrence counts and timestamps — so you can check your error log the same way you’d check any other dashboard screen.
The three constants above handle PHP error logging. For JavaScript errors, there’s a separate constant: SCRIPT_DEBUG.
define( 'SCRIPT_DEBUG', true );This forces WordPress to load full, unminified versions of its own core scripts. That makes JavaScript error messages in the browser console readable rather than cryptic references into compressed bundles. Use it during active debugging sessions and disable it when done.
LogMate’s settings panel lets you toggle SCRIPT_DEBUG directly from the WordPress admin without editing wp-config.php. It also captures WordPress JavaScript errors from visitor browser sessions server-side, so you see browser-side errors even from visitors you’re not actively watching, without needing SCRIPT_DEBUG permanently on.

If your hosting provider’s control panel offers a debug mode toggle — as cPanel, Kinsta, WP Engine, and others do — you can enable WP_DEBUG from there without touching the config file. Check your host’s documentation for the specific option.
For SCRIPT_DEBUG specifically, LogMate handles the toggle from inside the dashboard. For the PHP debugging constants, a code snippets plugin that lets you add PHP to wp-config.php from the admin is another option, though FTP access to the config file is the most reliable method.
Yes, with WP_DEBUG_DISPLAY set to false. Errors go to the log file silently without any visible change for your visitors. The risk is only when WP_DEBUG_DISPLAY is left at its default of true, which prints errors to the page. Always explicitly set it to false in a production environment.
Very slightly. PHP error checking adds minimal overhead to each request, and file writes to the debug log add a small amount of disk I/O. On most sites this is imperceptible. Where it becomes noticeable is on sites already generating thousands of log entries per hour — in that case, the high error volume is the performance concern, not the debug mode itself.
A rapidly filling debug log almost always means a plugin or theme is generating the same WordPress PHP error on every page load. Open LogMate’s Logs screen and sort by occurrence count — the entry with the highest count is almost certainly the culprit. Once you identify the source, address it (update the plugin, contact the developer, or deactivate it temporarily) and set up LogMate’s automatic log retention to keep the file size manageable going forward.
Set WP_DEBUG back to false in wp-config.php, or remove the define statement entirely. WordPress stops writing to the debug log immediately. The existing log file remains on disk until you delete or purge it — LogMate’s purge function handles this from the settings panel without needing server access.
Enabling WordPress debugging is a five-minute setup that gives you complete visibility into what your site is doing under the hood. The key is always setting WP_DEBUG_DISPLAY to false before going live. LogMate handles reading those logs from inside your dashboard, adds JavaScript error capture on top, and manages log retention automatically.
You might also like:

